337 nm Matrix‐assisted laser desorption/ionization of single aerosol particles

L. He, K.K. Murray, 337 nm Matrix‐assisted laser desorption/ionization of single aerosol particles, J. Mass Spectrom. 34 (1999) 909–914. doi:10.1002/(SICI)1096-9888(199909)34:9<909::AID-JMS849>3.0.CO;2-A.

Abstract

Single particle aerosol MALDI
Single particle aerosol MALDI mass spectrometer

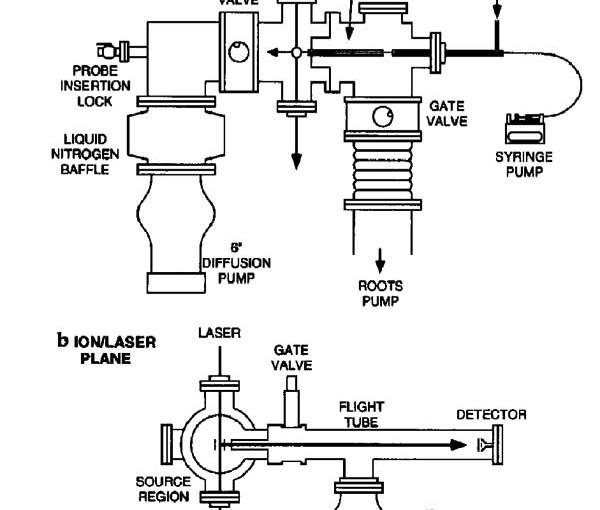
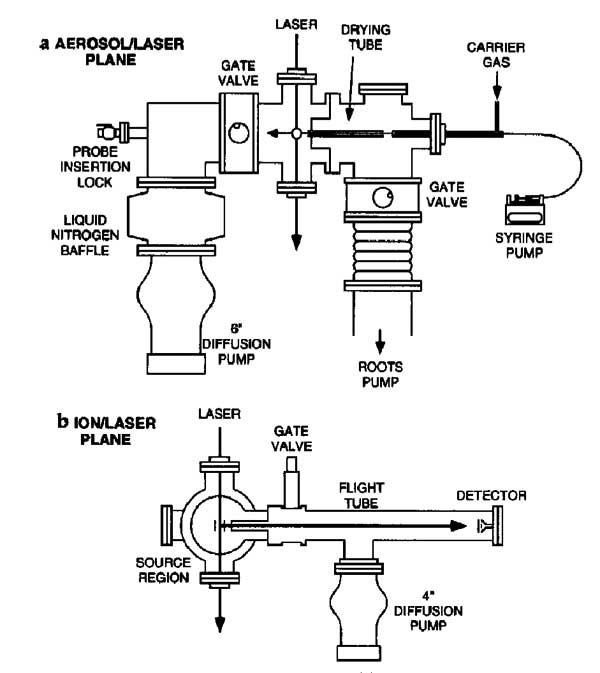
Matrix-assisted laser desorption/ionization (MALDI) mass spectra were obtained from single particles injected directly into a time-of-flight mass spectrometer. Aerosol particles were generated at atmospheric pressure using a piezoelectric single-particle generator or a pneumatic nebulizer and introduced into the mass spectrometer through a series of narrow-bore tubes. Particles were detected by light scattering that was used to trigger a 337 nm pulsed nitrogen laser and the ions produced by laser desorption were mass separated in a two-stage reflectron time-of-flight mass spectrometer. MALDI mass spectra of single particles containing bradykinin, angiotensin II, gramicidin S, vitamin B12 or gramicidin D were obtained at mass resolutions greater than 400 FWHM. For the piezoelectric particle generator, the efficiency of particle delivery was estimated to be approximately 0.02%, and 50 pmol of sample were consumed for each mass spectrum. For the pneumatic nebulizer, mass spectra could be obtained from single particles contg. less than 100 amol of analyte, although the sample consumption for a typical mass spectrum was over 400 pmol.

Aerosol MALDI instrument
Aerosol MALDI instrument at Emory University

Infrared matrix-assisted laser desorption/ionization using OH, NH and CH vibrational absorption

J.D. Sheffer, K.K. Murray, Infrared matrix-assisted laser desorption/ionization using OH, NH and CH vibrational absorption, Rapid Commun. Mass Spectrom. 12 (1998) 1685-1690; doi:10.1002/(SICI)1097-0231(19981130)12:22<1685::AID-RCM389>3.0.CO;2-S.

Abstract

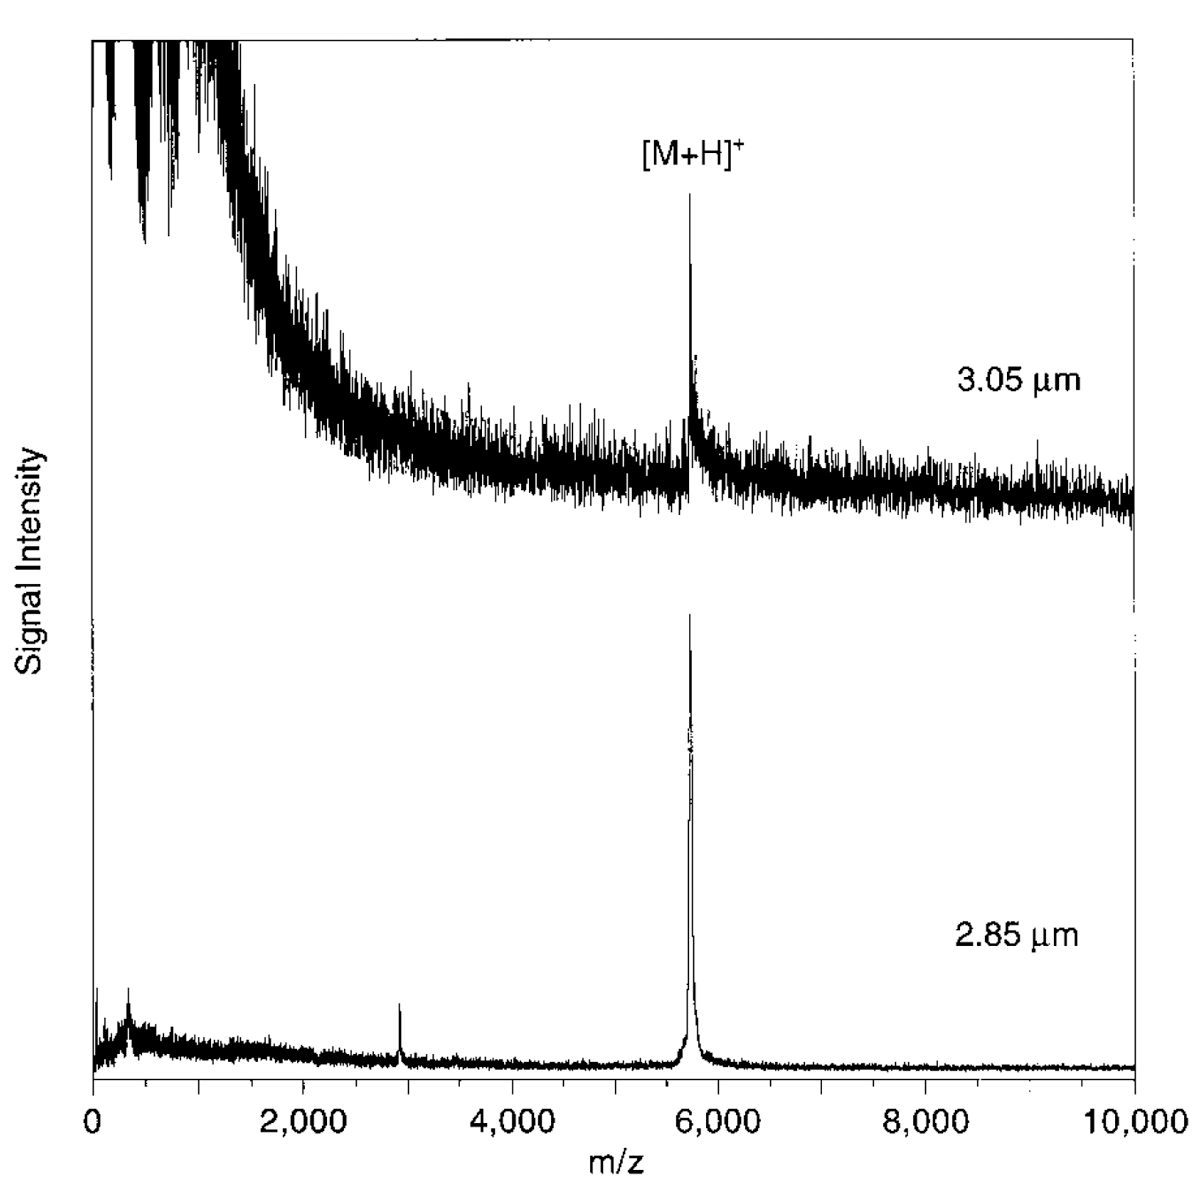
MALDI of bovine insulin with succinic acid matrix
MALDI mass spectra of bovine insulin with succinic acid matrix at 2.90 and 3.50 µm.

The matrices succinic acid (butanedioc acid), caffeic acid (3,4‐dihydroxycinnamic acid), and 4‐nitroaniline were used to obtain matrix‐assisted laser desorption/ionization (MALDI) time‐of‐flight mass spectra using a Nd:YAG‐pumped optical parametric oscillator (OPO). The matrices were used to ionize the protein bovine insulin at wavelengths between 2.6 and 4.0 μm. Protonated insulin was observed between 2.81 and 3.55 μm with succinic acid, between 2.73 and 3.5 μm with caffeic acid, and in two distinct bands with 4‐nitroaniline: one from 2.85 to 3.1 μm and another between 3.4 and 3.5 μm. The best signal and mass resolution were found at approximately 2.9 μm for all matrices. The minimum laser fluence required for MALDI (threshold fluence) was compared to the IR absorption spectra of the solid matrix. We found a good correlation between IR absorption and inverse threshold fluence for the NH and CH stretch absorption bands of 4‐nitroaniline. The threshold fluence was lower than expected between 2.81 and 3.3 μm for succinic acid and between 2.73 and 2.85 μm for caffeic acid. The low threshold fluence and good MALDI performance in the 2.9 μm region can be explained by free OH group or residual water absorption.

Liquid Sample Introduction for Matrix-Assisted Laser Desorption Ionization

K.K. Murray, D.H. Russell, Liquid Sample Introduction for Matrix-Assisted Laser Desorption Ionization, Anal. Chem., 65 (1993) 2534-2537; http://10.1021/ac00066a023.

Abstract

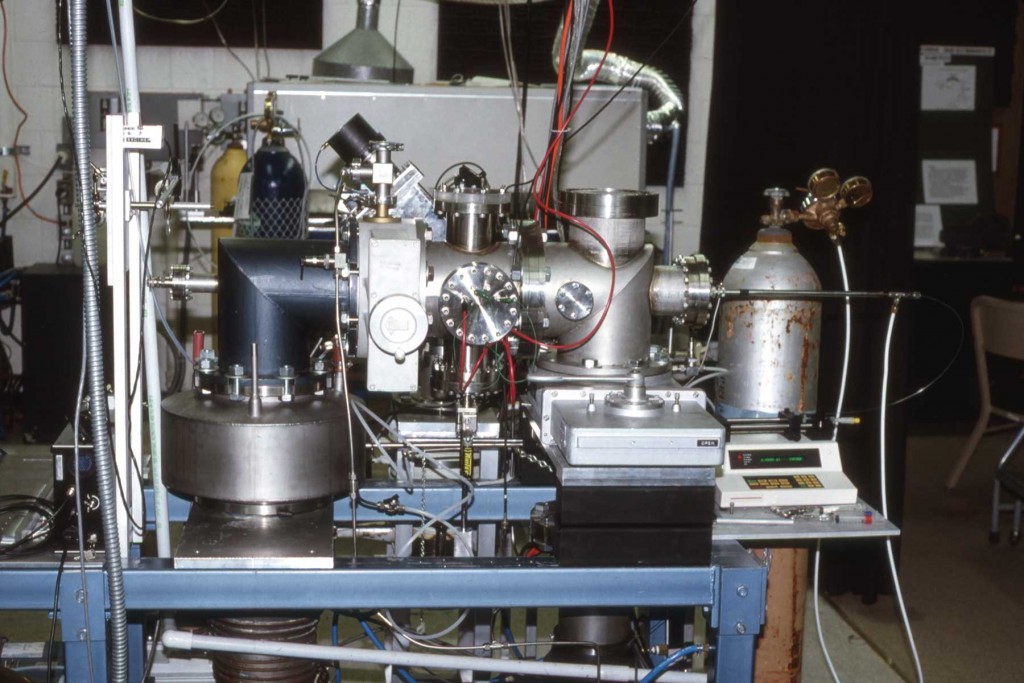
Aerosol MALDI apparatus at Texas A&M University

In this paper initial results are presented for a new liquid introduction method for a mass spectrometer based on the application of MALDI to aerosols. Details of the method will be presented in future publications. Aerosols are formed using a continuous pneumatic aerosol generator from an acidified methanol solution containing the matrix and analyte. The solvent is removed by passing the aerosol through a heated tube to form a collimated beam of dried particles. Ions are formed by irradiating the aerosol with pulsed UV radiation in the source region of a linear TOF MS. The advantages of the aerosol MALDI TOF method are (1) liquid flow capacity of 0.5 mL/min, (2) rapid acquisition of the entire mass spectrum, and (3) ionization of large peptides and proteins. In this paper, the aerosol MALDI mass spectra of gramicidin S and lysozyme (chicken egg white) are presented. Flow injection mass spectra of gramicidin S are presented to demonstrate the feasibility of coupling aerosol MALDI with HPLC.

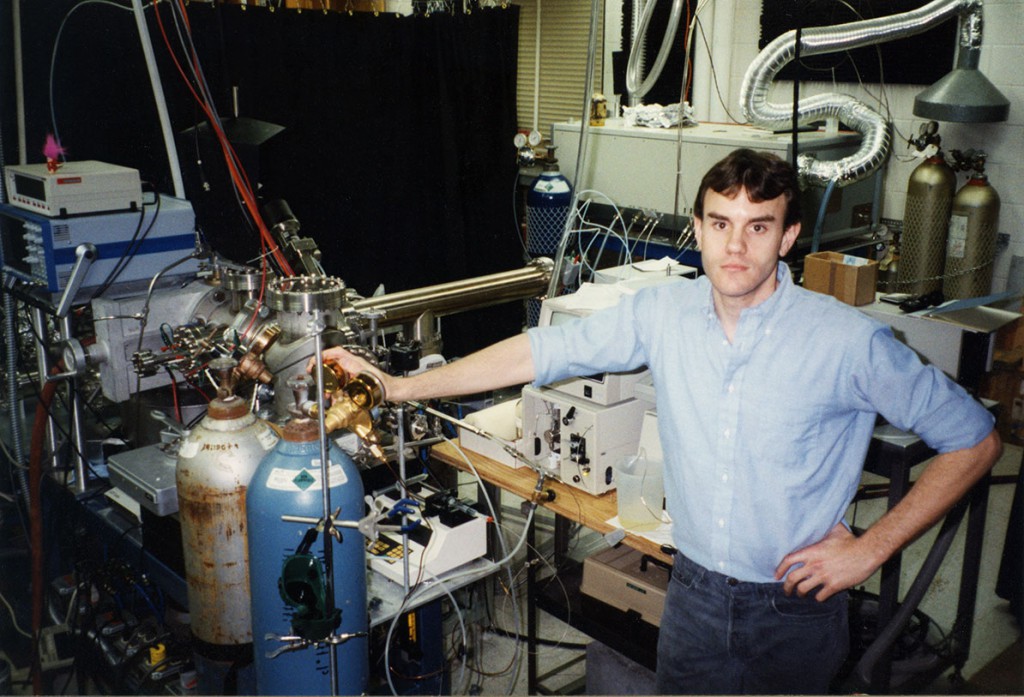
Kermit Murray at Texas A&M University in 1993
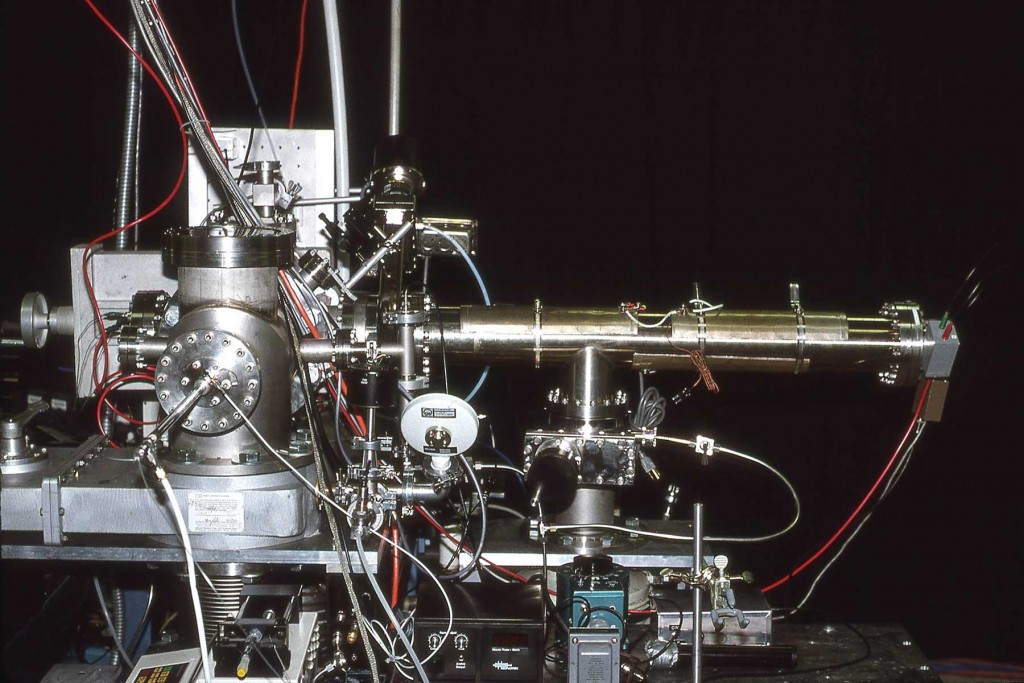
AMALDI side view
Texas A&M Aerosol MALDI instrument side view
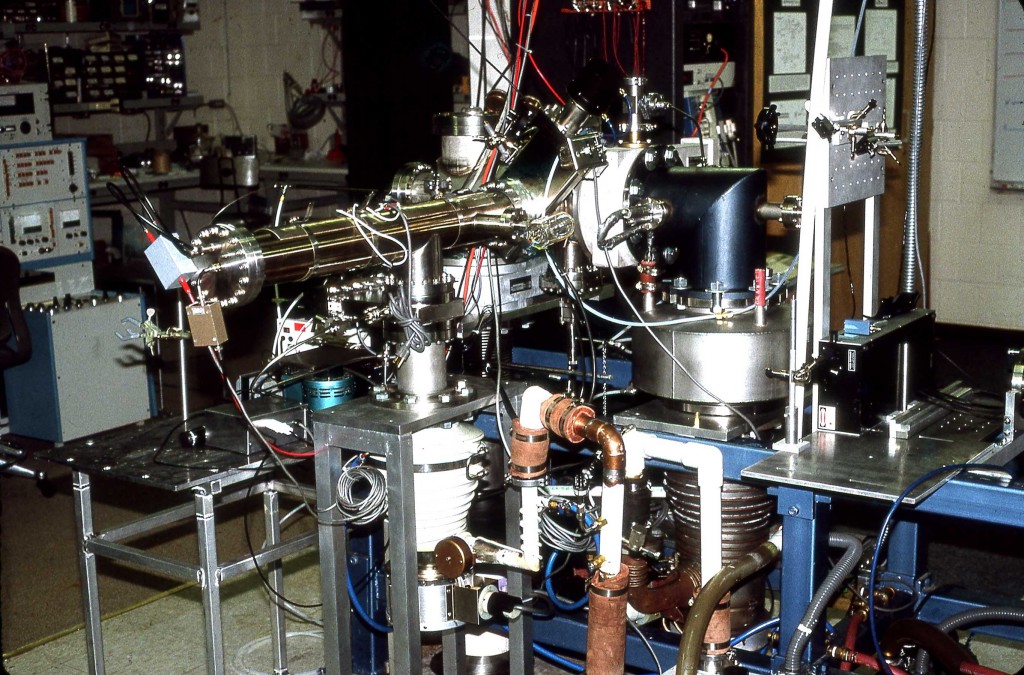
TAMU AMALDI Mass Spectrometer 1992
Aerosol MALDI instrument at Texas A&M University, showing the flight tube (right) and ion source (left).
AMALDI Instrument at Texas A&M
Aerosol MALDI Instrument at Texas A&M University, 1992.
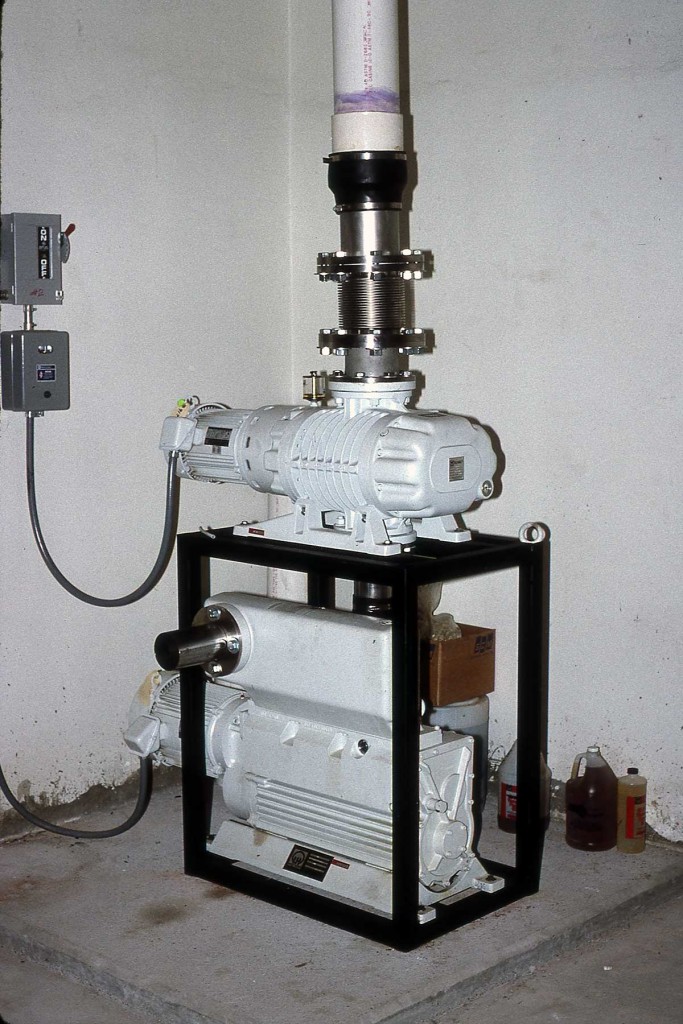
TAMU Roots pump
Roots blower and backing pump at Texas A&M University, 1992

Aerosol Matrix-Assisted Laser-Desorption Ionization Mass-Spectrometry

K.K. Murray, D.H. Russell, “Aerosol Matrix-Assisted Laser-Desorption Ionization Mass-Spectrometry, “ J. Am. Soc. Mass Spectrom. 5 (1994) 1–9. doi:10.1016/1044-0305(94)85077-1.

Abstract: A new method of liquid sample introduction for a time-of-flight mass spectrometer (TOF-MS) has been developed by applying the method of matrix-assisted laser desorption ionization to aerosols. Analyte biomolecules are dissolved in a methanol solvent along with a UVabsorbing matrix and formed into an aerosol with a pneumatic nebulizer. The aerosol particles are dried in a heated skimmer tube before ionization by pulsed 355-nm UV laser radiation. Mass analysis is achieved in a linear TOF-MS. Results for the ionization of bovine insulin (5733.5 Mw) are reported.

Aerosol MALDI apparatus at Texas A&M University
AMALDI side view
Texas A&M Aerosol MALDI instrument side view
TAMU AMALDI Mass Spectrometer 1992
Aerosol MALDI instrument at Texas A&M University, showing the flight tube (right) and ion source (left).
TAMU Roots pump
Roots blower and backing pump at Texas A&M University, 1992
AMALDI Instrument at Texas A&M
Aerosol MALDI Instrument at Texas A&M University, 1992.
Kermit Murray at Texas A&M University in 1993

Threshold photodetachment of H−

K.R. Lykke, K.K. Murray, W.C. Lineberger, “Threshold photodetachment of H−,” Phys. Rev. A. 43 (1991) 6104–6107. doi:10.1103/PhysRevA.43.6104.

Abstract

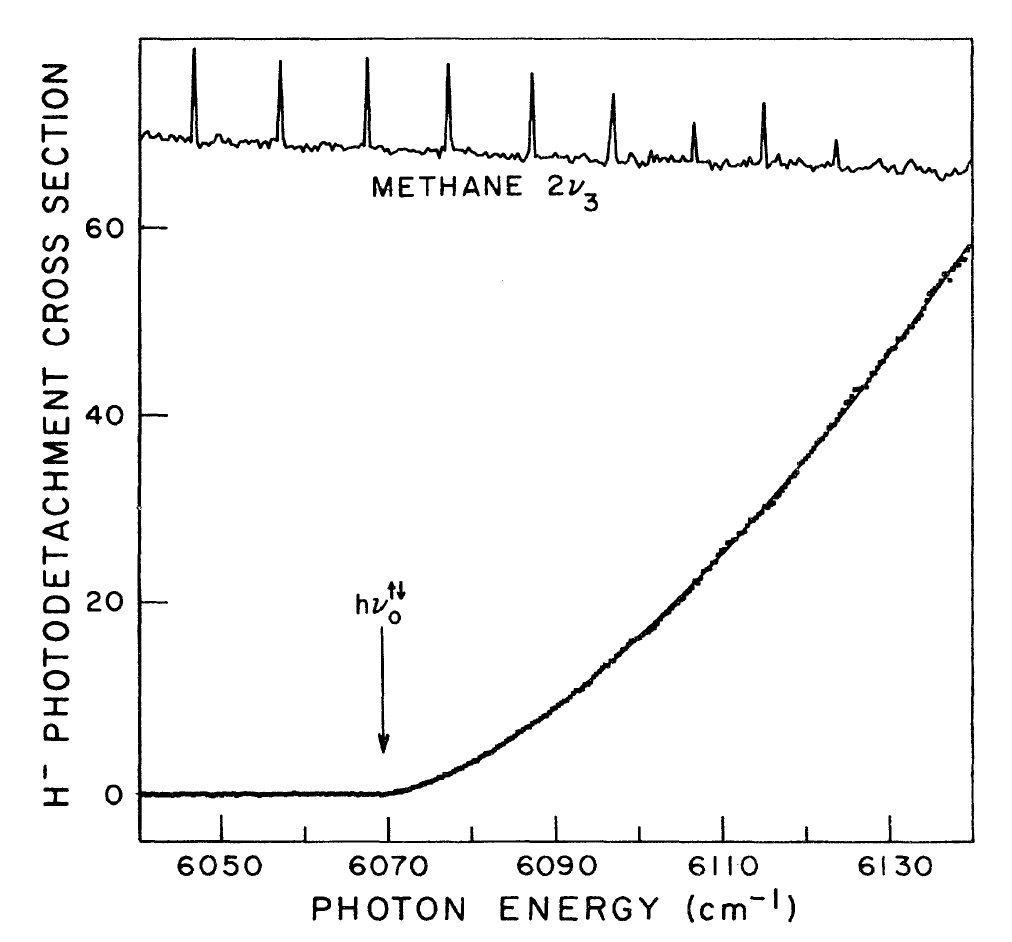
A 100 cm-1 scan of the H cross section with a fit to the E3/2 threshold law.

The electron affinities of atomic hydrogen and deuterium have been determined by tunable-laser threshold-photodetachment spectroscopy: the electron affinities of H (F=0) and D (F=1/2) are 6082.99±0.15 and 6086.2±0.6 cm−1, respectively. The value for H is a 20-fold improvement over previous experimental determinations.

Infrared spectroscopy of jet-cooled transient molecules

R. Curl, K.K. Murray, M. Petri, M. Richnow, F. Tittel, Infrared spectroscopy of jet-cooled transient molecules, Chem. Phys. Lett., 161 (1989) 98-102; doi: 10.1016/0009-2614(89)85038-9

Abstract

Pulsed valve jet-cooled radical setup
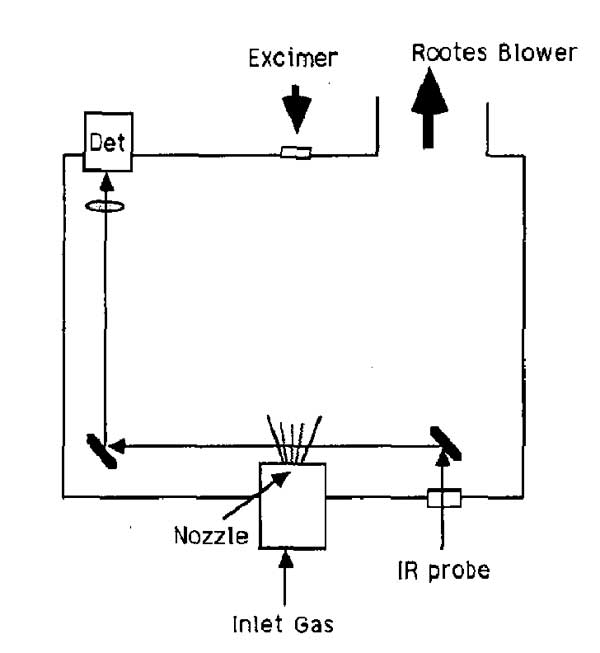
Pulsed valve jet-cooled radical setup: excimer laser fires toward (or across) the pulsed valve jet expansion to create radicals that are cooled in the expansion.

Free radicals are produced by excimer laser flash photolysis of a suitable precursor inside the nozzle of a pulsed slit jet and cooled by supersonic expansion from the slit. The infrared spectra of the radicals are then probed by a single-frequency color-center laser. This technique has been tested on the NH2 radical.

Photoelectron spectroscopy of halocarbene anions

K.K. Murray, D.G. Leopold, T.M. Miller, W.C. Lineberger, Photoelectron spectroscopy of the halocarbene anions HCF, HCCl, HCBr, HCI, CF2, and CCl2, J. Chem Phys, 89 (1988) 5442-5453; doi: 10.1063/1.455596

Abstract

The 488 nm photoelectron spectra are reported for the HCX(X̃1A’)+e−←HCX−(X̃2A‘) and HCX(ã3A‘)+e−←HCX−(X̃2A‘) transitions in HCF−, DCF−, HCCl−, HCBr−, and HCI− and for the CX2(X̃1A1)+e−←CX−2(X̃2B1) transitions in CF−2 and CCl−2 . Adiabatic electron affinities are found to be 0.557±0.005 eV (HCF), 0.552±0.005 eV (DCF), 1.213±0.005 eV (HCCl), 1.556±0.008 eV (HCBr), 1.683±0.012 eV (HCI), 0.179±0.005 eV (CF2), and 1.603 ± 0.008 eV (CCl2). Bounds for the triplet excitation energies are determined for all the halocarbenes for which photoelectron spectra were observed, with the exception of CCl2. For the HCX halocarbenes, upper bounds for the triplet excitation energies are 14.7±0.2 kcal/mol (HCF, DCF), 11.4±0.3 kcal/mol (HCCl), and 9±2 kcal/mol (HCBr). A more detailed analysis of HCF suggests the actual triplet excitation energy to be 11.4±0.3 kcal/mol, 14.7±0.2 kcal/mol, or 8.1±0.4 kcal/mol, with the first value the most likely. Since the multiplicity of the ground state of HCl is not known, we report the energy of its first excited state to be less than 9±2 kcal/mol. The absence of an observed triplet state in the CF−2 photoelectron spectrum allows us to assign a lower bound on the triplet excitation energy of CF2 of 50 ± 2 kcal/mol.

Methylene: A study of the X̃ 3B1 and ã 1A1 states by photoelectron spectroscopy of CH2−and CD2−

D.G. Leopold, K.K. Murray, A.E.S. Miller, W.C. Lineberger, Methylene: A study of the X̃ 3B1 and ã 1A1 states by photoelectron spectroscopy of CH2and CD2J. Chem Phys. 83 (1985) 4849. doi:10.1063/1.449746.

Abstract

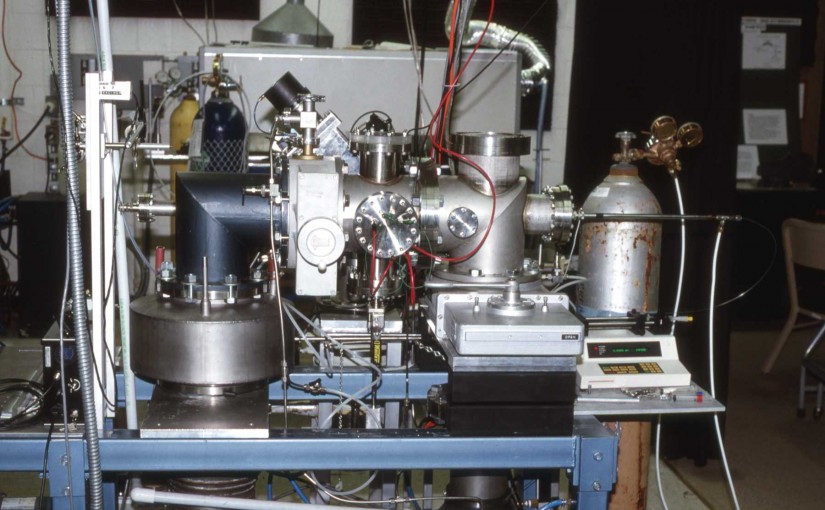
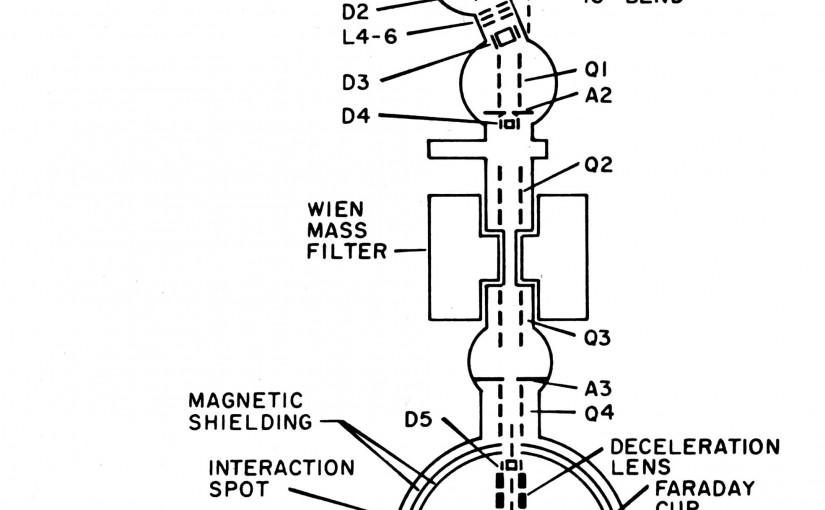
Apparatus from Leopold, Murray, Miller and Lineberger,  J. Chem. Phys. 83, 4849 (1985).
Apparatus from Leopold, Murray, Miller and Lineberger, J. Chem. Phys. 83, 4849 (1985).

Photoelectron spectra are reported for the CH2(X̃ 3B1)+e←CH2 (X̃ 2B1) and CH2(ã 1A1)+e←CH2(X̃ 2B1) transitions of the methylene and perdeuterated methylene anions, using a new flowing afterglow photoelectron spectrometer with improved energy resolution (11 meV). Rotational relaxation of the ions to ∼300 K and partial vibrational relaxation to <1000 K in the flowing afterglow negative ion source reveal richly structured photoelectron spectra. Detailed rotational band contour analyses yield an electron affinity of 0.652±0.006 eV and a singlet–triplet splitting of 9.00±0.09 kcal/mol for CH2. (See also the following paper by Bunker and Sears.) For CD2, results give an electron affinity of 0.645±0.006 eV and a singlet–triplet splitting of 8.98±0.09 kcal/mol. Deuterium shifts suggest a zero point vibrational contribution of 0.27±0.40 kcal/mol to the observed singlet–triplet splitting, implying a Te value of 8.7±0.5 kcal/mol. Vibrational and partially resolved rotational structure is observed up to ∼9000 cm−1 above the zero point vibrational level of the 3B1 states, revealing a previously unexplored region of the quasilinear potential surface of triplet methylene. Approximately 20 new vibration‐rotation energy levels for CH2 and CD2 are measured to a precision of ∼30 cm−1 in the v2=2–7 region (bent molecule numbering). Bending vibrational frequencies in the methylene anions are determined to be 1230±30 cm−1 for CH and 940±30 cm−1 for CD2, and the ion equilibrium geometries are bracketed. The measured electron affinity also provides values for the bond strength and heat of formation of CH2, and the gas phase acidity of CH3. A detailed description of the new flowing afterglow photoelectron spectrometer is given.

Laser photoelectron spectroscopy of vibrationally relaxed CH2−: A reinvestigation of the singlet–triplet splitting in methylene

D.G. Leopold, K.K. Murray, W.C. Lineberger, Laser photoelectron spectroscopy of vibrationally relaxed CH2: A reinvestigation of the singlet–triplet splitting in methylene, J. Chem Phys. 81 (1984) 1048–1050. doi:10.1063/1.447741.

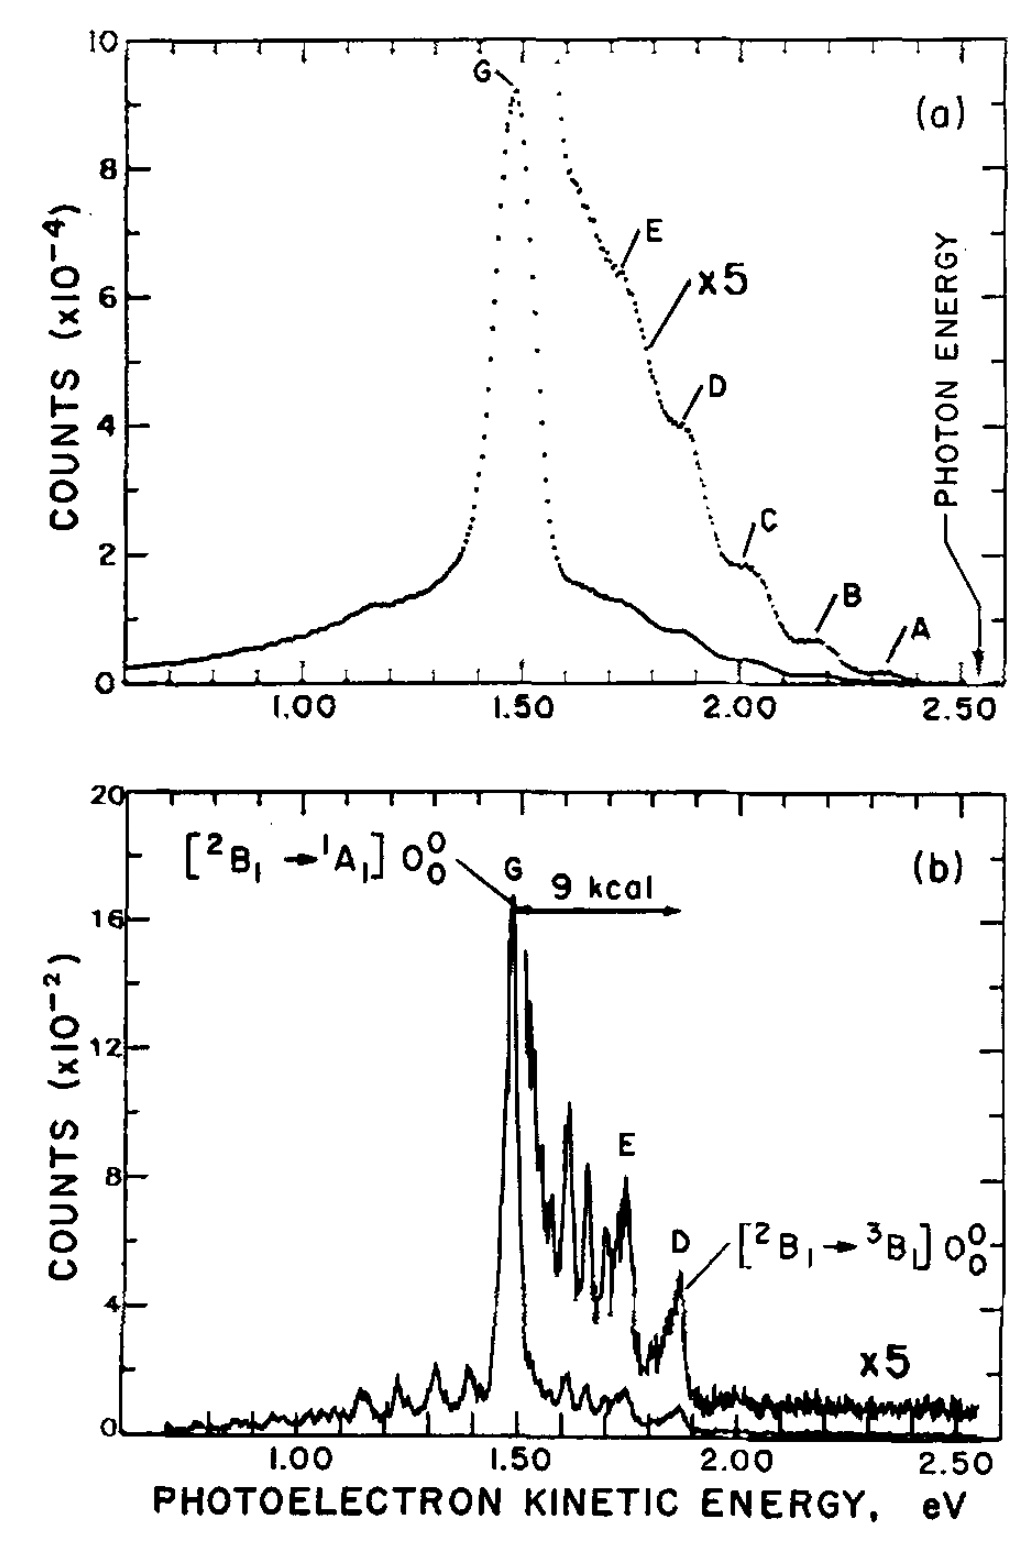
CH2- photoelectron spectra following 2.54 eV (488 nm) excitation.
CH2 photoelectron spectra following 2.54 eV (488 nm) excitation. (a) Previously reported spectrum (Zittel 1976, Engelking 1981) obtained with a gas discharge ion source. (b) Spectrum of vibrationally and rotationally cooled CH2 prepared in a flowing afterglow ion source. The instrumental resolution is 60 meV in (a) and 10 meV in (b). The absence of peaks A, B, and C in (b) establishes their hot band nature and gives II singlet-triplet splitting of 9 kcal/mol.

In view of the many questions concerning the photoelectron spectrum of CH2 we have reinvestigated this system using a new experimental apparatus which incorporates a flowing afterglow ion source, providing vibrational and rotational cooling of the sample ions. Results presented here enable several previously observed spectral features to be positively identified as vibrational hot bands, leading to a revised determination of the singlet-triplet splitting in methylene.

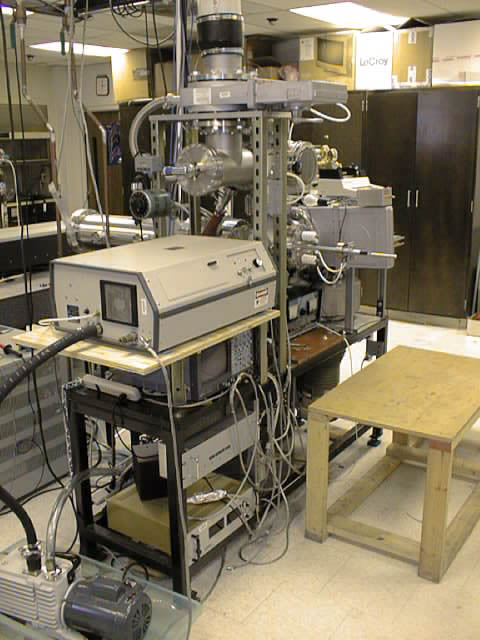
Wein filter magnet power supply
Negative ion photoelectron spectrometer in 2009; Wein filter magnet power supply
Negative ion photoelectron spectrometer in 2009